Business Intelligence
From Gut Feelings to Data: How Business Analytics Delivers 112% ROI
The Way Businesses Used to Make Decisions
Not long ago, a business owner would sit at the end of a long week, leaf through a stack of printed sales reports, and make a call based on what felt right. Intuition, experience, and a handful of numbers scribbled on paper were the primary tools of decision-making.
It worked, to a degree. But it was slow, prone to error, and almost entirely backward-looking. By the time the numbers reached the decision-maker, the market had already moved.
Then came spreadsheets. Then databases. Then ERP systems that brought financial and operational data under one roof. Each step was progress, but the underlying problem stayed the same: the data existed, but turning it into a clear, timely answer still took too long and required too many people in the middle.
What changed everything was not more data. It was the ability to see it in real time, in one place, and in a format that anyone in the business could actually understand. That is what business intelligence and analytics delivered. And it is what tools like Power BI made accessible to organizations that previously could not afford or staff a dedicated analytics team.
What Business Analytics Actually Means Today
Business analytics is the practice of using data, statistical methods, and software tools to analyze past performance and guide future decisions. It sits at the center of how modern organizations plan, operate, and compete.
It spans a spectrum: from basic reporting that tells you what happened, to diagnostic analytics that tells you why it happened, to predictive analytics that tells you what is likely to happen next, to prescriptive analytics that recommends what you should do about it.
The market reflects how seriously businesses are taking this. According to Straits Research, the global business intelligence market is valued at $39.79 billion in 2026 and is projected to reach $121.56 billion by 2034, growing at a compound annual growth rate of nearly 15%. That pace of growth is not driven by hype. It is driven by organizations that have seen what analytics does for operational efficiency, forecasting accuracy, and competitive positioning.
Key stat: Organizations with advanced BI maturity report 2.5 times faster decision-making and 40% higher ROI on their analytics investment, per DataStackHub.
The shift from reactive to proactive decision-making is the central story of business analytics in 2026. Companies are no longer waiting for quarterly reviews to understand where they stand. They are monitoring performance in real time and acting on it immediately.
What is Power BI and Why Does It Matter
The platform that democratized enterprise analytics
Power BI is Microsoft's business intelligence and analytics platform. As Microsoft's own documentation describes it, it is a suite of tools that connects to data sources, transforms and models that data, and presents it through interactive dashboards and reports that anyone in the organization can use, regardless of their technical background.
It comes in three main layers. Power BI Desktop is the free application where analysts connect data, clean it, build models, and design reports. Power BI Service is the cloud-based environment where those reports are published, shared, and collaborated on across teams. And Power BI Mobile allows decision-makers to access live dashboards from any device, anywhere.
According to TTMS, over 234,200 companies currently use Power BI, and it commands a 17% share of the global BI software market, ahead of competitors like Tableau and Qlik. Microsoft was also named a Leader in the 2025 Gartner Magic Quadrant for Analytics and Business Intelligence Platforms, with Power BI at the center of that recognition.
What makes Power BI software particularly significant is not its market share. It is the fact that it brought enterprise-grade performance analytics within reach of mid-market businesses that previously had neither the budget for custom analytics infrastructure nor the staff to maintain it.
What a Power BI dashboard actually shows you
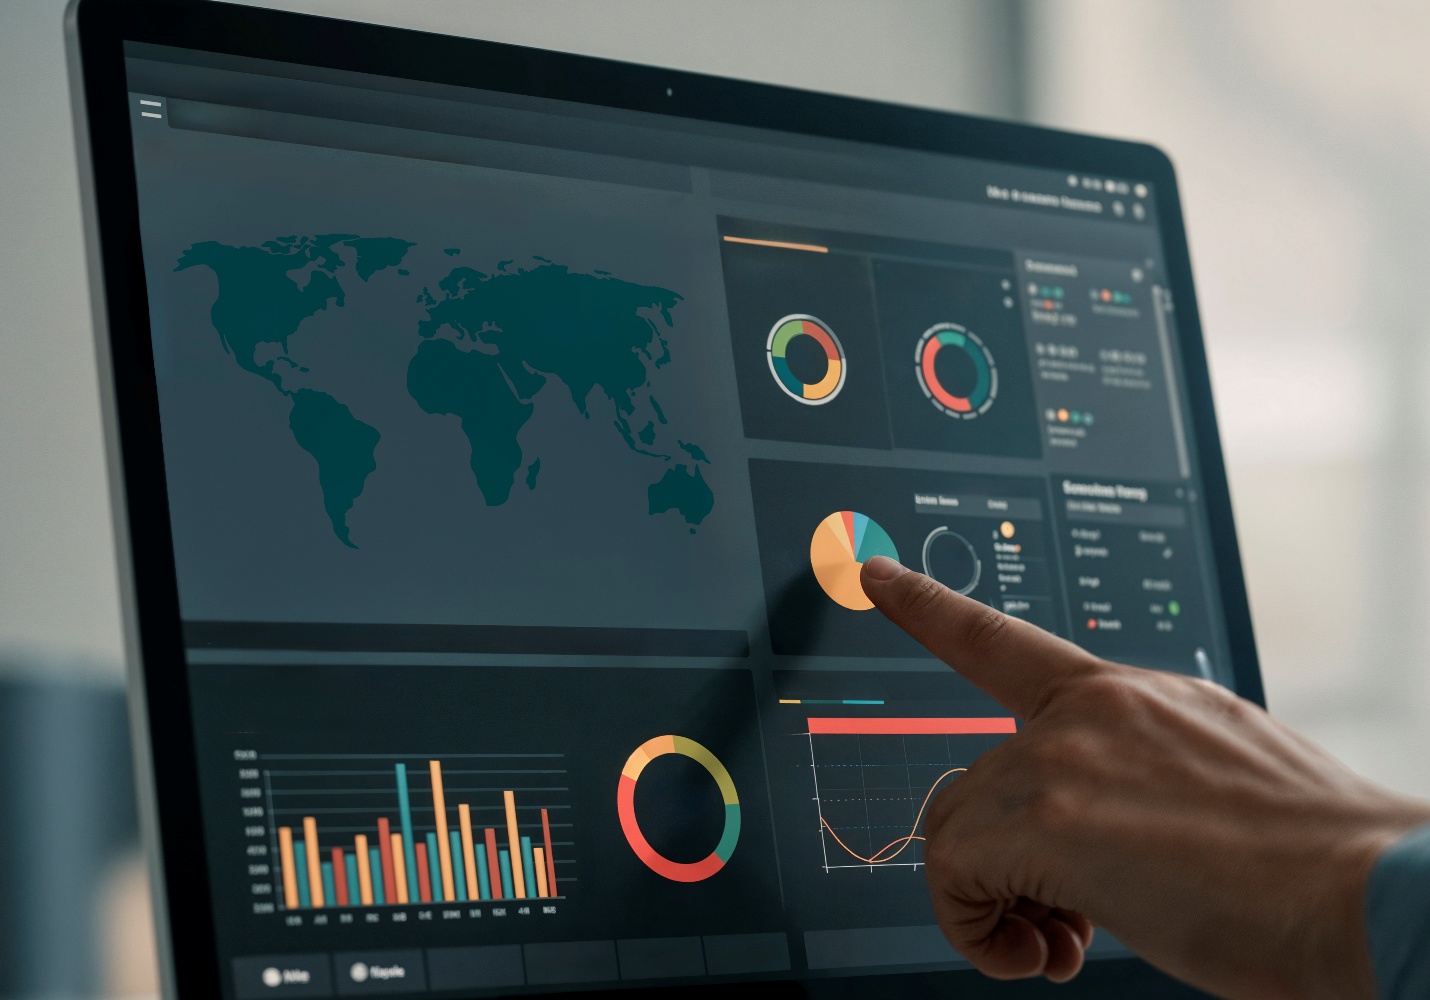
A Power BI dashboard is a single-screen view of the metrics that matter most to your business, updated automatically from your connected data sources. It replaces the manual process of pulling data from multiple systems, combining it in spreadsheets, and building reports by hand.
As the ERP Software Blog notes, Power BI integrates directly with ERP systems like Microsoft Dynamics 365, CRM platforms, cloud databases, and hundreds of other data sources. When you connect it to your existing systems, the dashboard becomes a live window into your entire operation: sales performance by region, inventory levels, cash flow forecasts, customer acquisition costs, and operational KPIs all in one place.
The more recent evolution of Power BI goes further still. Microsoft's 2025 update introduced Copilot integration, which allows users to ask questions in plain language and receive charts and insights instantly. A sales manager can type "show total revenue by region for Q2" and the dashboard builds itself. This is what makes modern BI software genuinely accessible to non-technical users across a business.
The Gap Between Data and Decision
Despite the tools available, many businesses still struggle to close the gap between having data and acting on it. Research cited by DreamITCS found that 70% of business executives say they have difficulty taking action on data, even as 73% of companies are increasing their investment in analytics skills and capabilities.
The problem is rarely a lack of data. Most businesses are generating more data than they know what to do with. The problem is structure. Data sits in disconnected systems. Reports are built manually. Dashboards are designed by IT teams that are not always close to the operational questions that need answering. And when insights finally surface, they are often too old to act on.
According to Verified Market Research, 42% of businesses face integration issues when implementing BI tools, and 37% report high implementation costs as the primary barrier. These are not technology problems. They are implementation and strategy problems. The tools work. Getting them set up correctly, connected to the right data sources, and adopted across teams is where most projects stall.
This is the point at which the difference between deploying BI software and actually running a business analytics program becomes clear. The software is available to almost anyone. Building a program around it that actually changes how decisions get made requires planning, data governance, and ongoing management.
The 112% ROI: What Performance Analytics Actually Delivers
Performance analytics is the discipline of tracking the right indicators to evaluate how well a business is operating and whether it is moving toward its goals. It is the practical output of a business analytics program: the metrics on the dashboard, the alerts that fire when something is off track, and the reports that go to leadership each week.
Getting performance analytics right requires answering two questions before touching any software. What are you actually trying to achieve? And what data would tell you whether you are achieving it?
Most organizations make the mistake of measuring everything that is easy to measure rather than everything that matters. This leads to dashboards full of data that no one acts on, and decisions still being made on instinct because nobody can find the signal in the noise.
The businesses that get real value from BI investment start with a small, prioritized set of KPIs aligned to business strategy, connect those to reliable data sources, and build reporting around them before expanding. Nucleus Research data cited by Scoop Market shows that companies using BI effectively experienced an average ROI of 112% with a payback period of just 1.6 years. That return comes from decisions made better and faster, not from the dashboards themselves.
The real advantage: Data-driven organizations are 23 times more likely to acquire customers and 6 times more likely to retain them, per DataStackHub's 2025-2026 BI Statistics Report.
Business Analytics Software: Choosing the Right Stack
Power BI is not the only business analytics software on the market, but it is the most widely adopted for good reason. It sits inside the Microsoft ecosystem, which most organizations already use. It integrates natively with Excel, Teams, SharePoint, Azure, and Dynamics 365. And it scales from a single-user free license to an enterprise deployment with thousands of users and centralized governance.
For organizations operating on Microsoft infrastructure, Power Business Intelligence is a natural fit. The data connections are pre-built, the security model integrates with existing Active Directory and Entra ID policies, and the collaboration features work inside Teams and SharePoint without additional configuration. As Improvado's 2026 BI trends analysis notes, organizations that deploy predictive analytics consistently report 30-40% improvements in forecast accuracy and 20-25% reductions in wasted spend across marketing, operations, and supply chain functions.
The choice of BI software matters less than the quality of the data it connects to and the clarity of the questions it is being asked to answer. A Power BI dashboard built on clean, well-governed data and aligned to the right KPIs will outperform any platform built on fragmented or unreliable inputs.
Turning BI Investment Into a Real, Measurable Return
Business analytics is not a technology decision. It is a business decision about how your organization makes choices, monitors performance, and responds to change. The technology, whether that is Power BI, a broader BI software stack, or an integrated analytics and reporting setup, is the means, not the end.
The businesses that extract the most from their BI investment share a few things in common. They start with clear questions rather than available data. They invest in data quality before they invest in visualization. They connect their analytics to the systems where work actually happens, whether that is an ERP, a CRM, or an operational database. And they treat analytics as an ongoing program, not a one-time project. Coherent Market Insights' 2026 BI market analysis confirms that professional services around BI implementation, training, and ongoing optimization are the fastest-growing segment of the analytics market, accounting for 62% of total spend. Organizations are recognizing that deploying the software is only the beginning.
For organizations that want to close that gap between having data and acting on it, Tylextech works with businesses to implement and manage business analytics programs built around Power BI and integrated with existing ERP, cloud, and managed IT infrastructure. The goal is not just a better dashboard. It is a business that makes faster, more confident decisions at every level.
Because in 2026, the businesses that win are not the ones with the most data. They are the ones that can see it clearly and act on it first.
Business Analytics That Delivers 112% ROI in 2026
From gut feelings to real-time Power BI dashboards, discover how modern business analytics delivers 112% ROI and 2.5x faster decisions for your business.